Centralized Reporting with ChromeOS Readiness Tool: One Dashboard, All Your Insights
The ChromeOS Readiness Tool features a comprehensive and user-friendly web-based dashboard designed to help organizations effectively monitor and manage their transition to ChromeOS. This centralized dashboard provides real-time visibility into the readiness status of devices across the entire organization.
With customizable views and filtering options, IT administrators can easily identify readiness trends, pinpoint devices requiring attention, and make informed decisions to support a smooth and efficient deployment of ChromeOS.
Key Features of the Web Dashboard Explained
A high-level readiness score is provided, along with detailed breakdowns by compatibility status and application usage across the organization.
Real-time compatibility assessments for individual devices.
Detailed insights into connected peripherals, including their compatibility status.
Comprehensive browser insights, such as browser usage, browser version data, and extension details. This feature provides centralized visibility, helps identify unauthorized extensions to improve security posture, and simplifies browser management.
Accessing readiness details on the web dashboard requires uploading the private key generated during tool deployment. This ensures that only the user who deployed the tool and possesses the private key can access the collected data. Accessing the dashboard typically involves signing in with a Google account.
Specific Dashboard Types
There are primarily two types of web dashboards, each designed to serve distinct user needs, and the dashboard will be enabled only if the user selects GCP as the storage method.
Reporting Dashboard
The Reporting Dashboard appears on the administrator’s machine once data collection is completed, displaying the information generated by the Report Generator, which is responsible for compiling and producing the organizational and device readiness reports.
Shows the total application count for each readiness status.
Includes a pie chart displaying the percentage of devices in each readiness category.
Lists all devices in the selected domain with their readiness status.
Provides an application summary for each device, categorized as Chrome Ready, Possibly Ready, Blocker, or Unknown.
Allows clicking on a device to view a detailed summary of its specific applications.
The data insight section includes a summary of devices in each readiness category and a list of the most used applications and their readiness categories.
Users can find previous reports in the history reports section.
Raw data reports can be downloaded in Excel format, providing an overview of device readiness and an overview of peripherals. These Excel sheets can be used for visualization in tools like Looker, Tableau, or PowerBI.
A summary of the collected data can be downloaded as a PDF report.
Feedback submitted by the admin can be reviewed.
Pro Dashboard
Available for pro company users.
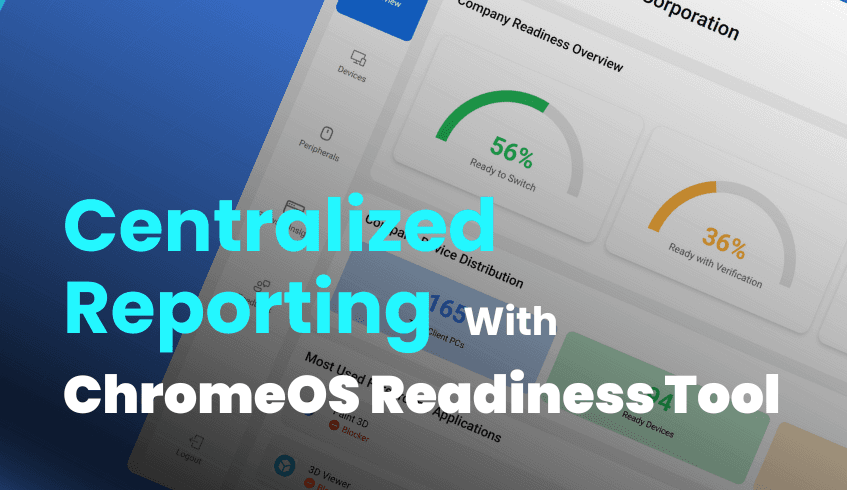
Provides a detailed company readiness overview with statuses and percentages, total domain count, and device distribution.
Shows the most used applications categorized into foreground and background, with details and status.
Displays ChromeOS Readiness data for each domain, including device count, readiness status, and percentages of Chrome Ready applications and peripherals.
Allows drilling down into specific applications by clicking on data points in the devices section.
Provides detailed information about peripheral devices, including names, overall readiness status, and device counts.
Users can submit and review feedback.
Partner Dashboard
Available for partner companies managing multiple customers, and partners can view customer details only by entering the relevant private key.
After entering the customer's Private Key, detailed readiness data, including an overview, device distribution, device counts, readiness percentages, and Chrome Ready apps/peripherals, are accessible.
Allows viewing readiness data for specific domains of an organization.
Provides details on peripheral devices, including core readiness status percentage, device distribution data, names, status, and counts.
Offers filters for devices based on readiness status.
Users can submit and review feedback.
Summary
In summary, the ChromeOS Readiness Tool provides various dashboard views tailored for different user types and installation methods, all designed to give comprehensive insights into an organization's readiness for a ChromeOS transition. Access to detailed data on these dashboards is secured through the use of a private key.